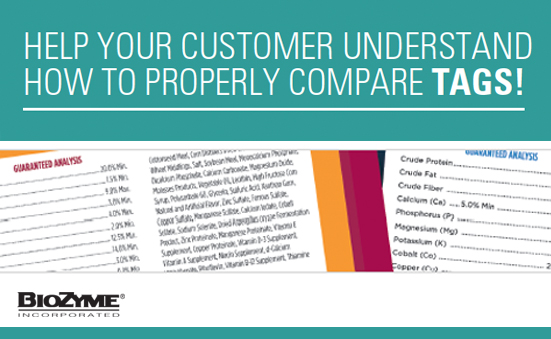
Helping your customers properly analyze tags is important when comparing products. Here is some helpful information to help you ensure your customers are comparing apples to apples!
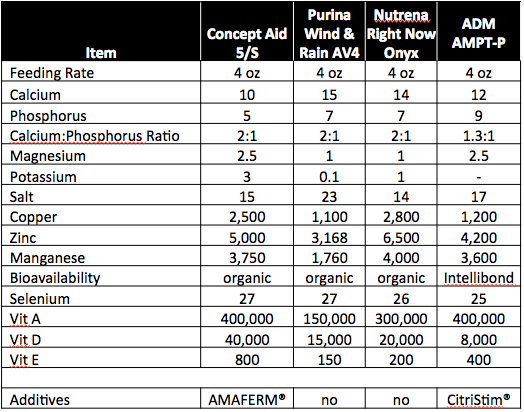
When analyzing feed tags, you must adjust for feeding rate in order to properly compare products. See example charts below.
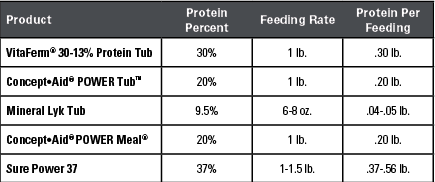
Protein, Fat, Fiber and Macro Minerals
(calcium, phosphorus, magnesium and potassium) are listed as a % minimum or maximum.
- A supplement that is 20% protein would contain 0.20 lb. of protein in each 1 lb. of feed.
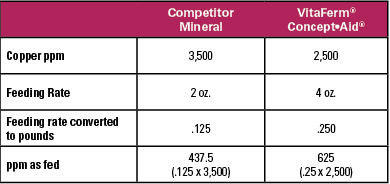
Trace Minerals
(copper, zinc, manganese and selenium) are expressed as “ppm” or parts per million.
- One part per million is the same as one milligram per kilogram
- 1 kilogram = 2.2 pounds
- Must know feeding rate in pounds to truly compare ppm
Vitamins A, D and E
are expressed in IU/lb.
- An IU is an International Unit and is based on the effectiveness of a particular vitamin.
- A supplement that lists 100 IU/lb. of Vitamin E, fed at 5 lbs. per day, provides 500 IU’s per day.
- A supplement that lists 800 IU/lb. of Vitamin E, fed at 4 oz. per day, provides 200 IU’s per day (4 oz./16 oz. = .25 times 800 IU/lb.)