Dealers must stay on their toes to monitor the ever-changing inventory trends, seasons and customer demands. One way is to proactively optimize your inventory and make sure that you’re stocking the right products, at the right time. To accomplish this, identify and track certain metrics that give you a better understanding of how inventory is moving through the dealership:
A. Inventory Turnover [cost of goods sold / average inventory]
Also known as stock turn, this metric refers to the number of times that product has sold out for a particular time period.
Example: To keep numbers simple, a dealer’s average inventory costs $10,000 and it sold $50,000 worth of goods within a 12-month period. In this case, the dealer’s stock turnover rate is 5.0, which means that it sold out its inventory five times that year.
Monitoring stock turn is a must, since it lets you see how fast merchandise is moving in your business. Generally speaking, a high stock turn rate is good, because it means you’re not tying up too much capital in your inventory.
You can also compute for stock turn at a per product basis so you can figure out how fast different products are selling out. If product A has a turnover rate of 1.0, and product B’s turnover rate is 7.0, then you know that B is selling much more quickly. This serves as an indicator that you’ll need to order more of item B, and less of item A.
B. Gross Margin ROI [gross margin / average inventory cost]
The GMROI measures your return on the amount you invested in stock. It basically answers questions like, “How many gross margin dollars did I make from my inventory investment?” or “For every dollar invested in inventory, how many dollars did I get back?”
Example: A dealer’s average inventory cost is $25,000 and has gross margin of $60,000. The GMROI would be 2.4. In other words, the retailer earns $2.40 for each dollar spent on inventory.
When computed at a store-wide level, GMROI can give you insight on the overall health of your dealership. This metric can also be calculated at a per-product basis so you can determine whether it’s worthwhile to carry certain products.
Say you recently started selling a product in your store. You run the GMROI on it (by taking its gross profit then dividing it by your average inventory at cost) and find that the result isn’t as great as you’d like. You can then use this data to decide on what to do with the product (i.e. take it off the floor, put it on sale, etc.).
C. Sell-Through Percentage [units sold / (units on hand + units sold) x 100]
The sell-through percentage pertains to the number of units sold versus the number of units you had at the beginning. It’s a metric used to assess product performance. It illustrates how fast merchandise is moving and how many more units you have to sell to unload your inventory.
Example: A dealer received 200 units of Vita Charge® Liquid Boost®, and proceeds to sell 145 after a month. That item’s sell-through percentage is 73 percent. Sell-through gives you an idea of which products are selling and will allow you to make better decisions when it comes to what to stock up on, what to put on sale, etc.
Tip: Check to see if your point-of-sale or inventory system provides these metrics for you. Before pulling out your calculator to compute for these metrics, see if you can find the insights you need using your inventory or POS software. Some systems can generate reports on popular products as well as your margins, so you won’t have to do math yourself.
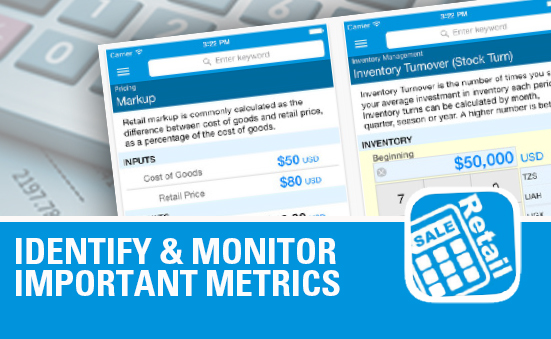
Alternatively, you can download Retail Calculators, an app that has several preset calculators in one program, allowing you to compute for common business metrics without having to memorize any of the formulas.