What’s It Worth? Let’s Do the Math

Typical Customer Rebuttal:
“OK, fine. I can afford a mineral program, but that
VitaFerm® stuff is just too expensive”

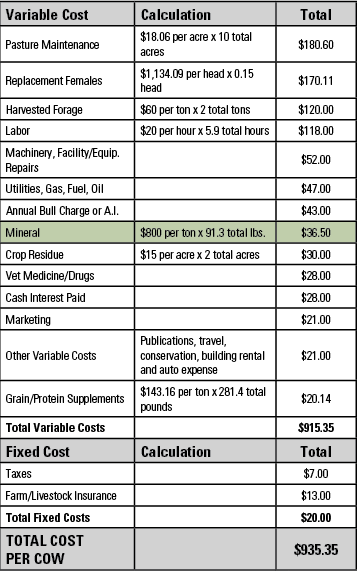
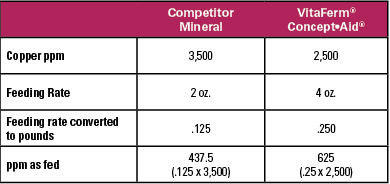
While the study at Kansas State University estimates mineral costs at $36.50 per cow, per year, it is true that VitaFerm will be approximately $56.74 if using our top-of-the-line VitaFerm lines, Concept•Aid® and Heat. That’s $20 more per cow. Before you walk away, see the breakdown below so you can fully understand how you and/or your customers can’t afford to NOT feed VitaFerm mineral.

What are More Weaned Pounds Worth?
According to Reinaldo Cooke, PhD, Oregon State University, supplementing cows with organic trace minerals led to weaning weights of 519 lbs. vs 466 lbs. for the control (no supplementation but were not mineral deficient), giving the cows with organic trace mineral supplementation a 53 lb. or $74/hd advantage, or a 28 lb. or $39/hd advantage over the inorganics. VitaFerm uses Optimins® for organic trace minerals in all formulas.

What are Even More Weaned Pounds Worth?

screen-shot-2016-09-14-at-3-32-48-pm

What’s One More Calf Worth?
A 2.5% increase in the calf crop (1 calf per 40 cows), at a 550 lb. weaning weight, would increase the average weight of the calves by 13.75 lbs., and at $1.40/lb., would increase the average revenue per cow by $19.00.

What is Keeping them Cool Worth?

  • 0.4 increase in average days open when beef cows experience heat stress (1.6 to 0 days across the USA)
  • 0.4 more days at 2.5 lbs. of gain per day a calf is on the ground, equates to $1 per cow, per year
  • Donor cows flush less when heat stressed. The typical flush is 8 eggs per cow. A trial on VitaFerm HEAT with 8 donor cows led to 105 eggs instead of the typical 64 in the year before.

What is Keeping them Grazing Worth?
The average producer feeding harvested hay has a per cow, per day cost between $1.25 to $2.00. More days on grass means less days of feeding harvested hay. This is difficult to calculate, so we will just keep this in mind while determining value.

What else can they say:
“OK, OK, OK.”

  • Optimins® Value: $39 more revenue for a heavier calf at weaning
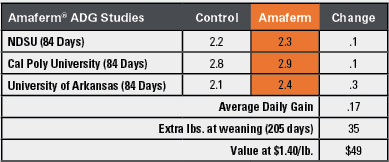
  • Amaferm® Value:
    – $49 more revenue for a heavier calf at weaning
    – $19 more revenue for 1 more calf across the herd
    – $1 more revenue for less average open days
  • A 5 to 1 return before we even talk about forage savings!

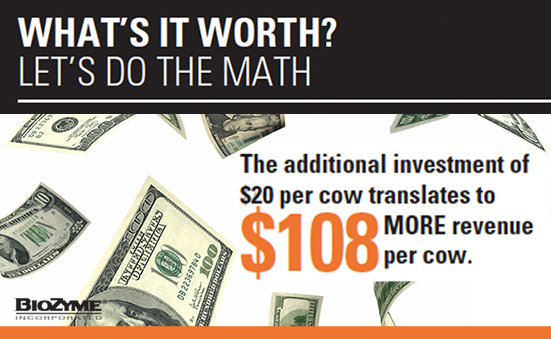
The additional investment of $20 per cow translates to $108 more revenue per cow.

Click Here to Download the Understanding the Value brochure that includes all of this information in a format you can share with your customers.

What Does Mineral Supplementation Really Cost?

Typical Customer Objection:
“I understand the nutrition is great… I just don’t have the revenue to cover such a large cost in my operation.”

When cattle producers are trying to cut costs, mineral programs
seem to be the first to go… But should they be?
According to Kansas
State University, the average cost per cow, per year is as follows:

screen-shot-2016-09-14-at-3-30-26-pm

According to this cost breakdown:

  • Year Round Mineral Cost = $36.50 per cow
  • Mineral accounts for only 3.9% of total cost
  • Harvested forage is 12.8% of total cost

According to a recent study by Reinaldo Cooke, PhD., Oregon State University, supplementing cows with inorganic trace minerals led to weaning weights of 25 lbs. more than the control (no supplementation but not mineral deficient). Using $1.40/lb., this equates to a $35 per head advantage.

What does this mean?

  • A mineral program will end up costing you $1.50 per year, per cow (=$36.50-$35)
  • That is 0.2% of the total cost per cow, per year

Now that you know what it really costs, do the math to find out what it’s really worth – click here.

Help Your Customers Understand How to Properly Compare Tags

Helping your customers properly analyze tags is important when comparing products. Here is some helpful information to help you ensure your customers are comparing apples to apples!

When analyzing feed tags, you must adjust for feeding rate in order to properly compare products. See example charts below.

Protein, Fat, Fiber and Macro Minerals
(calcium, phosphorus, magnesium and potassium) are listed as a % minimum or maximum.

  • A supplement that is 20% protein would contain 0.20 lb. of protein in each 1 lb. of feed.

screen-shot-2016-09-14-at-3-23-41-pm

Trace Minerals
(copper, zinc, manganese and selenium) are expressed as “ppm” or parts per million.

  • One part per million is the same as one milligram per kilogram
  • 1 kilogram = 2.2 pounds
  • Must know feeding rate in pounds to truly compare ppm

screen-shot-2016-09-14-at-3-23-51-pm

Vitamins A, D and E
are expressed in IU/lb.

  • An IU is an International Unit and is based on the effectiveness of a particular vitamin.
  • A supplement that lists 100 IU/lb. of Vitamin E, fed at 5 lbs. per day, provides 500 IU’s per day.
  • A supplement that lists 800 IU/lb. of Vitamin E, fed at 4 oz. per day, provides 200 IU’s per day (4 oz./16 oz. = .25 times 800 IU/lb.)

screen-shot-2016-09-14-at-3-27-37-pm

Consistency is Key to Great Branding

Your favorite country band is coming to town and you have tickets. After months of waiting, the night of the show is finally here and you get to hear all of your favorite songs. However, that morning the band decided they didn’t like playing the same songs every night so they played two hours of pop covers instead. You leave feeling dejected and can’t understand why they wouldn’t play the music that made them great.

Though this would probably never happen with a band in real life, it does happen with brands quite often. Consistency is repetitive, and because we are the ones delivering that message day after day we sometimes feel like our message has become boring. What is actually the case is that consistency paves the way for creativity with an impact and is what moves your brand from a good one to a great one.

So, what is your brand? A brand is what sets you apart from everyone else. It can be anything – a symbol, design, name, sound, reputation, slogan, emotion, employees and more – that separates one thing from another. A brand gives your business an identity. Do you want to be just a feed salesperson, or someone everyone knows because of your consistent message and identification? The sales person who listens to your customers’ goals and offers suggestions to help achieve those goals? According to North Star Marketing, here are four advantages to being consistent with your branding message:

Consistency helps manage perceptions. By thinking carefully and deliberately about your brand, you can shape how people perceive your organization. Consistency connotes professionalism, purpose and stability.

Consistency conveys outlook and attitude. A focused effort to establish and maintain consistent branding will deliver a very specific set of impressions: Are you serious? Are you intentional? Do you follow through? Are you focused?

Consistency eliminates issues surrounding brand confusion. For many companies, their branding is actually more of a hindrance than a help. A consistent brand should instill confidence rather than confusion.

Consistency protects your investment. Without established brand standards, many organizations spend thousands of dollars crafting a logo and building a message, only to have it degraded by inconsistent, sloppy application. Build equity in your brand by being consistent.

As you position your product before customers, be sure to brand yourself or your business. Keep the message consistent in your producer meetings, brochures, Facebook posts and media interviews. If you use a tag line on the bottom of a direct mail piece, make sure that same tag line is on your web site. If you have a logo, keep it consistent on your marketing pieces – don’t change the font or color. Remember, when you need help with marketing pieces, you can contact Katie Vaz at kvaz@biozymeinc.com. She can help you work toward consistency in your positioning by adding your logo or brand slogan to any of the current marketing pieces.

Source: http://www.northstarmarketing.com/2015/05/07/the-difference-between-a-good-brand-and-a-great-brand-consistency/

Added Value Should Mean Added Profitablity

Adding value is the process of changing or transforming a product from its original state to a more valuable state; from one set of characteristics to other characteristics that are more preferred in the marketplace.

Today, the “produce-then-sell” mentality of the commodity business is being replaced by the strategy of first determining what attributes consumers want in their products and then creating or manufacturing products with those qualities. Market forces have led to greater opportunities for product differentiation and added value because of:

  • Increased consumer demand regarding health, nutrition and convenience;
  • Efforts to improve productivity; and
  • Technological advances that enable production of what consumers desire.

Adding value to products can be accomplished in a number of ways, but generally falls into two categories: innovation and coordination. One or both of these must do more than add value. To be sustainable, they must also increase profitability.

Innovation

Innovation focuses on improving existing processes, procedures, products and services or creating new ones.

Impact on profitability – sales revenue is a function of volume and price. Value-added products allow more emphasis to be placed on the price part of the equation, initially, but ultimately they will also impact the volume, thereby increasing sales revenue. Your company’s strategy should be to find sources of revenue where you can have both high volumes and good prices.

The relatively new HEAT product is a great example of value-added innovation. By adding Xtract 7065, garlic and Amaferm® we have a summer mineral that adds value by:

  • Lowering heat stress so animals eat instead of standing in the shade or the ponds
  • Repelling insects
  • Increasing digestibility so food consumed is utilized more efficiently offsetting the negative impacts of fescue in certain areas of the country

The product is priced such that we have the profitability part of the
equation covered. In its first year, 26 tons of product was sold.
However, the added value that this product provides has impacted the volume part of the revenue equation as well; sales grew to 455 tons in 2015, and to 1,202 tons as of June 30, 2016. This value-added product has accomplished the strategy of finding a source of revenue where we can have both high volumes and good pricing for maximized sales revenue.

Coordination

Coordination focuses on arrangements among those that produce and market products. Horizontal coordination involves pooling or consolidation among individuals or companies from the same level of the food chain. An example would be hog producers combining their market hogs to make a truckload. A coordinated effort is needed to impact cost reduction.

Impact on profitability – before examining value-added processing and marketing, cost minimization must be achieved. Only efficient businesses will be able to survive and compete. Adding value cannot take the place of reaching the efficiencies attainable through technology and economies of scale.

Our mega dealers are a good example of coordination. They buy large orders and then disseminate the product out in smaller amounts at a significantly lower cost and more efficiency than an LTL company.

No matter innovation or coordination, in the end, value-added is a fairly simple concept. Create relationships with customers to encourage repeat business, improve tactics and your profits will go up.

You Can Only Pick Two

As a marketer and designer, I have always quietly laughed at this diagram that is often shared online by seemingly frustrated freelancers or business owners who are fed up with the expectation of their customers.

A simple Google search of this “good, fast, cheap diagram” will show that not only does the marketing and design industry share these feelings, but that modifications of these little circles show up everywhere in nearly every profession from construction to investment banking to the food industry.

While there may be much truth to these circles, I have learned over time that frustration diminishes quickly for both service provider and customer when you identify where you both fit within the diagram. If you occupy different circles, it simply means that maybe you don’t have to offer what your customer expects and what your customer expects is not possible based on what you can provide. But when you do exist in the same circles, the relationship can be pretty perfect.

We have taken it upon ourselves to modify a diagram for you as dealers. BioZyme dealers most definitely represent the QUALITY PRODUCTS circle as you carry the best products in the business as indicated by the ingredients and proven record of their ability to create performance that pays. There are other circles you may represent as well. Now it is up to you to identify which level of expectation your customers have and what circle(s) they fit. It’s ok that some customers might not fit perfectly. They merely need to be educated on why “quality” is important or how the service you offer directly impacts the value they place on time or having a consultant at their door to help make important decisions for their operation. Sometimes it is ok to just know that they have no interest crossing over into overlapping portions of the circle, and you don’t have to waste each other’s time or resources marketing to that type of customer.

The sooner you begin existing in the same circle(s) so that the product and service you are providing matches your customers’ expectation, the sooner you will create an environment of known expectation and synergistic goals in which everyone involved is satisfied with the end result.

Using Your Inventory Calendar as a Marketing Tool

Setting an inventory calendar can be useful for more than just inventory management. It can serve as the framework and guide for your marketing schedule as well. It makes sense to align marketing and promotion with the inventory your housing at the time and to be prepared to turn seasonal stock as quickly as possible.

Consistency is often one of the biggest struggles for dealers, and establishing a marketing plan can give you a guide to follow to help you stay on course and in front of your customers in the most effective way possible.

First, establish the list of marketing tools you plan to use to reach your customers.

That list may look something like this:

  • Radio Ads
  • Facebook Posts / Social Media
  • Event Marketing
  • Email Marketing
  • Text Messaging Service
  • Local Business Flyers

Next, reference your inventory calendar to know what items you should be promoting for that respective month. Promotions need to be done in advance of your selling season to prepare customers, so it’s always good to set your marketing plans 3-5 months in advance.

An inventory calendar will help paint a visual picture of the opportunities you have to focus on, what promotional efforts could be combined or if it is necessary to run multiple campaigns simultaneously. Obviously margin and/or volume will factor into your focus each month, but don’t leave out ‘door-opener’ products that could generate traffic or interest as well.

Once you’ve established your product focus for the month, detail your marketing plan to include specific tactics, contacts you need to reach out to, deadlines, etc. There are several tools and programs you can use for social media, email marketing and text messaging services that allow you to schedule in advance so you only have to manage these messages once per month.

At the end of the month, you should revisit each marketing medium used and analyze its effectiveness so you can make any necessary adjustments for coming months.

Forecasting Sales Seasonality

Inventory management is an art that can elevate your business to new heights if done well. It is highly variable, and the optimal system is different for each dealer. There are many tools that can be implemented to improve your inventory management – and cash flow!

Techniques such as First-In First-Out (FIFO), setting par levels, having a contingency plan to address unforeseen issues should they occur, auditing regularly and classifying inventory so you have a system to prioritize the most important stock are all vital parts of inventory management.

Successful inventory management involves balancing the costs of inventory with the benefits of inventory. Many dealers fail to fully appreciate the true costs of carrying inventory, which includes not only direct costs of storage, insurance and taxes, but also the cost of money tied up in inventory. This fine line between keeping too much inventory and not enough is not the only concern. Others include:

  • Maintaining a wide assortment of stock — but not spreading the rapidly moving ones too thin;
  • Increasing inventory turnover — but not sacrificing the service level;
  • Keeping stock low — but not sacrificing service or performance;
  • Obtaining lower prices by making volume purchases — but not ending up with slow-moving inventory; and
  • Having an adequate inventory on hand — but not getting caught with obsolete items.

Perhaps one of the most important elements to finding this balance is accurate forecasting.

A huge part of good inventory management comes down to accurately predicting demand. Make no mistake, this is incredibly hard to do. There are so many variables involved and you’ll never know for sure exactly what’s coming, but you can get pretty close. Here are a few things to look at when projecting your future sales:

  • Trends in the market
  • Last year’s sales during the same week/month
  • This year’s growth rate
  • Guaranteed sales from contracts and subscriptions
  • Seasonality and the overall economy
  • Upcoming promotions
  • Planned ad spending

If there’s something else that will help you create a more accurate forecast, be sure to include it.

A helpful planning tool would be to graph product sales from last year by month so you have a picture that serves as a rough forecasting tool to help stay ahead of ordering and marketing.

Accurate inventory management incorporates what you know about customer and product demand from the past and present to (ideally) predict your best course of action in the future.

Optimize the value of such information by coupling your inventory management and marketing promotions to work together (More on page 10). For example, such insights can reveal potential opportunities to leverage quantity-based pricing suppliers may offer, while at the same time empowering you to offset times of lower demand with promotions or ‘packaged’ deals that strategically drive sales.

It is always best practice to ensure you have product on the floor at least 2 weeks prior to the beginning of selling season for each product and then use the forecasting tools above to prepare for restocking throughout the season.

Identify and Monitor Important Metrics

Dealers must stay on their toes to monitor the ever-changing inventory trends, seasons and customer demands. One way is to proactively optimize your inventory and make sure that you’re stocking the right products, at the right time. To accomplish this, identify and track certain metrics that give you a better understanding of how inventory is moving through the dealership:

A. Inventory Turnover [cost of goods sold / average inventory]

Also known as stock turn, this metric refers to the number of times that product has sold out for a particular time period.

Example: To keep numbers simple, a dealer’s average inventory costs $10,000 and it sold $50,000 worth of goods within a 12-month period. In this case, the dealer’s stock turnover rate is 5.0, which means that it sold out its inventory five times that year.

Monitoring stock turn is a must, since it lets you see how fast merchandise is moving in your business. Generally speaking, a high stock turn rate is good, because it means you’re not tying up too much capital in your inventory.

You can also compute for stock turn at a per product basis so you can figure out how fast different products are selling out. If product A has a turnover rate of 1.0, and product B’s turnover rate is 7.0, then you know that B is selling much more quickly. This serves as an indicator that you’ll need to order more of item B, and less of item A.

B. Gross Margin ROI [gross margin / average inventory cost]

The GMROI measures your return on the amount you invested in stock. It basically answers questions like, “How many gross margin dollars did I make from my inventory investment?” or “For every dollar invested in inventory, how many dollars did I get back?”

Example: A dealer’s average inventory cost is $25,000 and has gross margin of $60,000. The GMROI would be 2.4. In other words, the retailer earns $2.40 for each dollar spent on inventory.

When computed at a store-wide level, GMROI can give you insight on the overall health of your dealership. This metric can also be calculated at a per-product basis so you can determine whether it’s worthwhile to carry certain products.

Say you recently started selling a product in your store. You run the GMROI on it (by taking its gross profit then dividing it by your average inventory at cost) and find that the result isn’t as great as you’d like. You can then use this data to decide on what to do with the product (i.e. take it off the floor, put it on sale, etc.).

C. Sell-Through Percentage [units sold / (units on hand + units sold) x 100]

The sell-through percentage pertains to the number of units sold versus the number of units you had at the beginning. It’s a metric used to assess product performance. It illustrates how fast merchandise is moving and how many more units you have to sell to unload your inventory.

Example: A dealer received 200 units of Vita Charge® Liquid Boost®, and proceeds to sell 145 after a month. That item’s sell-through percentage is 73 percent. Sell-through gives you an idea of which products are selling and will allow you to make better decisions when it comes to what to stock up on, what to put on sale, etc.

Tip: Check to see if your point-of-sale or inventory system provides these metrics for you. Before pulling out your calculator to compute for these metrics, see if you can find the insights you need using your inventory or POS software. Some systems can generate reports on popular products as well as your margins, so you won’t have to do math yourself.

Alternatively, you can download Retail Calculators, an app that has several preset calculators in one program, allowing you to compute for common business metrics without having to memorize any of the formulas.

Displays that Wow Your Customers

Product displays, if executed well, are guaranteed to stop customers and generate interest. When marketing to the show livestock audience, keep in mind that exhibitors often play more of a role in feeding decisions than you may assume, so your display should cater to a younger demographic. During the breeding season, cattlemen may prefer a display that educates them about the challenges products help them overcome. Every product and audience is different. The following are a few tips to keep in mind as you hone in on your merchandising skills:

LOOKS MATTER
Make sure your display fully embraces the product brand. BioZyme® invests a great deal of money and energy promoting brands to the end customer, and therefore, it would be in your best interest to stay consistent with the respective brand look. Because of the diversity in types of dealers within our networks, we are happy to discuss options in customizing a display to fit your space.

COMMUNICATE EFFECTIVELY
Communicating a clear understanding of what a product does is key to successful selling. Remember that communication is not limited to words: both the visual and written language of a display must also carry a cohesive message. A successful design is one that will seamlessly integrate with the rest of your marketing campaign (and in this case, the national marketing campaign efforts of BioZyme brands).

PRODUCT IS KING!
Ultimately, every display has one goal: to sell product! Displays that overwhelm the product defeat their purpose at retail. Make sure that your display is making the product the star. If your retail area does not have enough space to showcase every product, make sure you are highlighting those small pack products (Vita Charge®, Vitalize and the new Sure Champ® Spark) as conversation starters so you can lead in to telling customers about the larger mineral products available as well.

ADD VALUE FOR YOUR CUSTOMER
Every new display project is an opportunity to create value for your customer. Value can be created through timely placement (putting the right product out at the right time), added education or a sales promotion or bundled products.  Consider a display that can be changed according to time of year so your customer benefits when most appropriate for their business.

For help with your store displays, contact Katie Vaz, Marketing and Communications Manager, at kvaz@biozymeinc.com or 816-596-8782.